A corporate credit rating is a compact verdict on whether a company can pay back what it owes. Agencies like Moody's, S&P, and Fitch produce them through a process that is slow, expensive, and partly subjective. For a research project at UC Davis, our five-person team asked a narrower question: can a machine-learning model reproduce those ratings from a company's financial ratios alone, and explain its reasoning instead of hiding behind a black box?
The short answer is yes. A Random Forest trained on 7,805 real agency ratings predicts the correct credit band about 79% of the time, and the final web app runs the model entirely in your browser. My part of the work was the neural-network model and the exploratory data analysis, plus the literature review that shaped how all three of our models were built. Here is the story of the project, and what I took from it.
Two questions
The project was framed by two questions. First, the predictive one: can a model recover an agency's rating using only a company's reported financial ratios? Second, the interpretable one: if it can, can we also see which financials drove the decision, rather than trusting a black box?
A tree-based model is unusually well suited to both. It is strong on tabular financial data, and it can report feature importance, so the answer comes with its reasoning attached.
The data, and the decision that mattered most
The model learns from a public dataset of corporate credit ratings, each row pairing an agency's rating with the issuer's financial profile: 7,805 rated filings, 1,377 unique corporations across 12 sectors, rated by Moody's, S&P, Fitch, and others. Each company carries 19 input features, 16 of them financial ratios spanning liquidity, leverage, margins, returns, and cash flow.
Running the exploratory analysis was my part of the early work, and the first thing it surfaced was how lopsided the labels are: most companies sit in the A and BBB bands, while the lowest ratings barely appear at all.
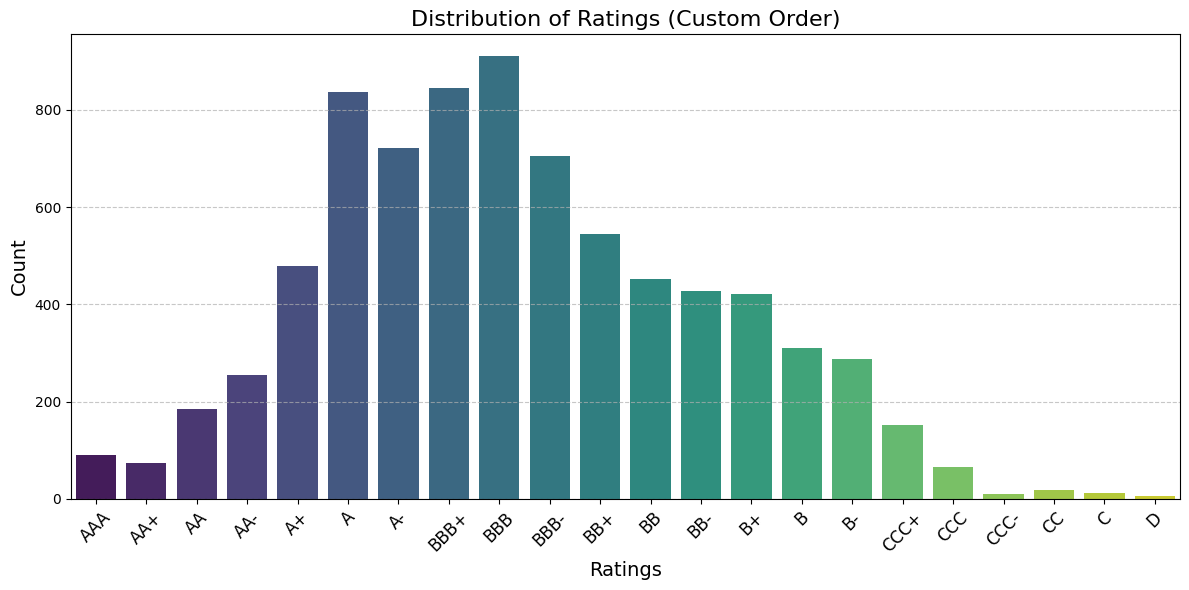
That imbalance drove the highest-leverage decision in the whole project, and it was not a model choice. It was label engineering. Agencies use more than twenty fine-grained notches (AAA, AA+, AA, AA-, and so on), many with only a handful of examples. Collapsing the 23 raw ratings into 5 credit bands, AAA/AA, A, BBB, BB, and B or below, made the problem tractable and turned out to be the single biggest driver of accuracy in the study. The lesson stuck with me: framing the target well mattered more than any model tuning.
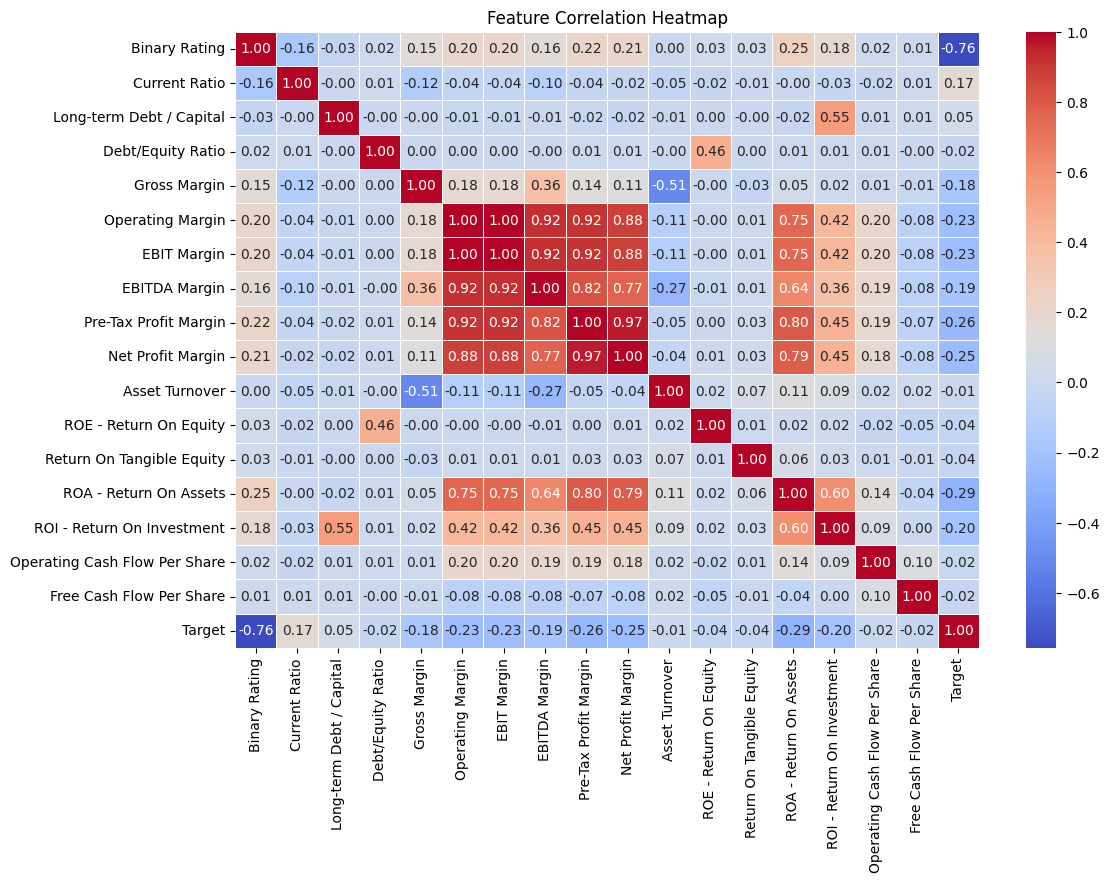
A correlation heatmap across the financial ratios then guided feature selection toward the strongest, least-redundant predictors.
The models, and what won
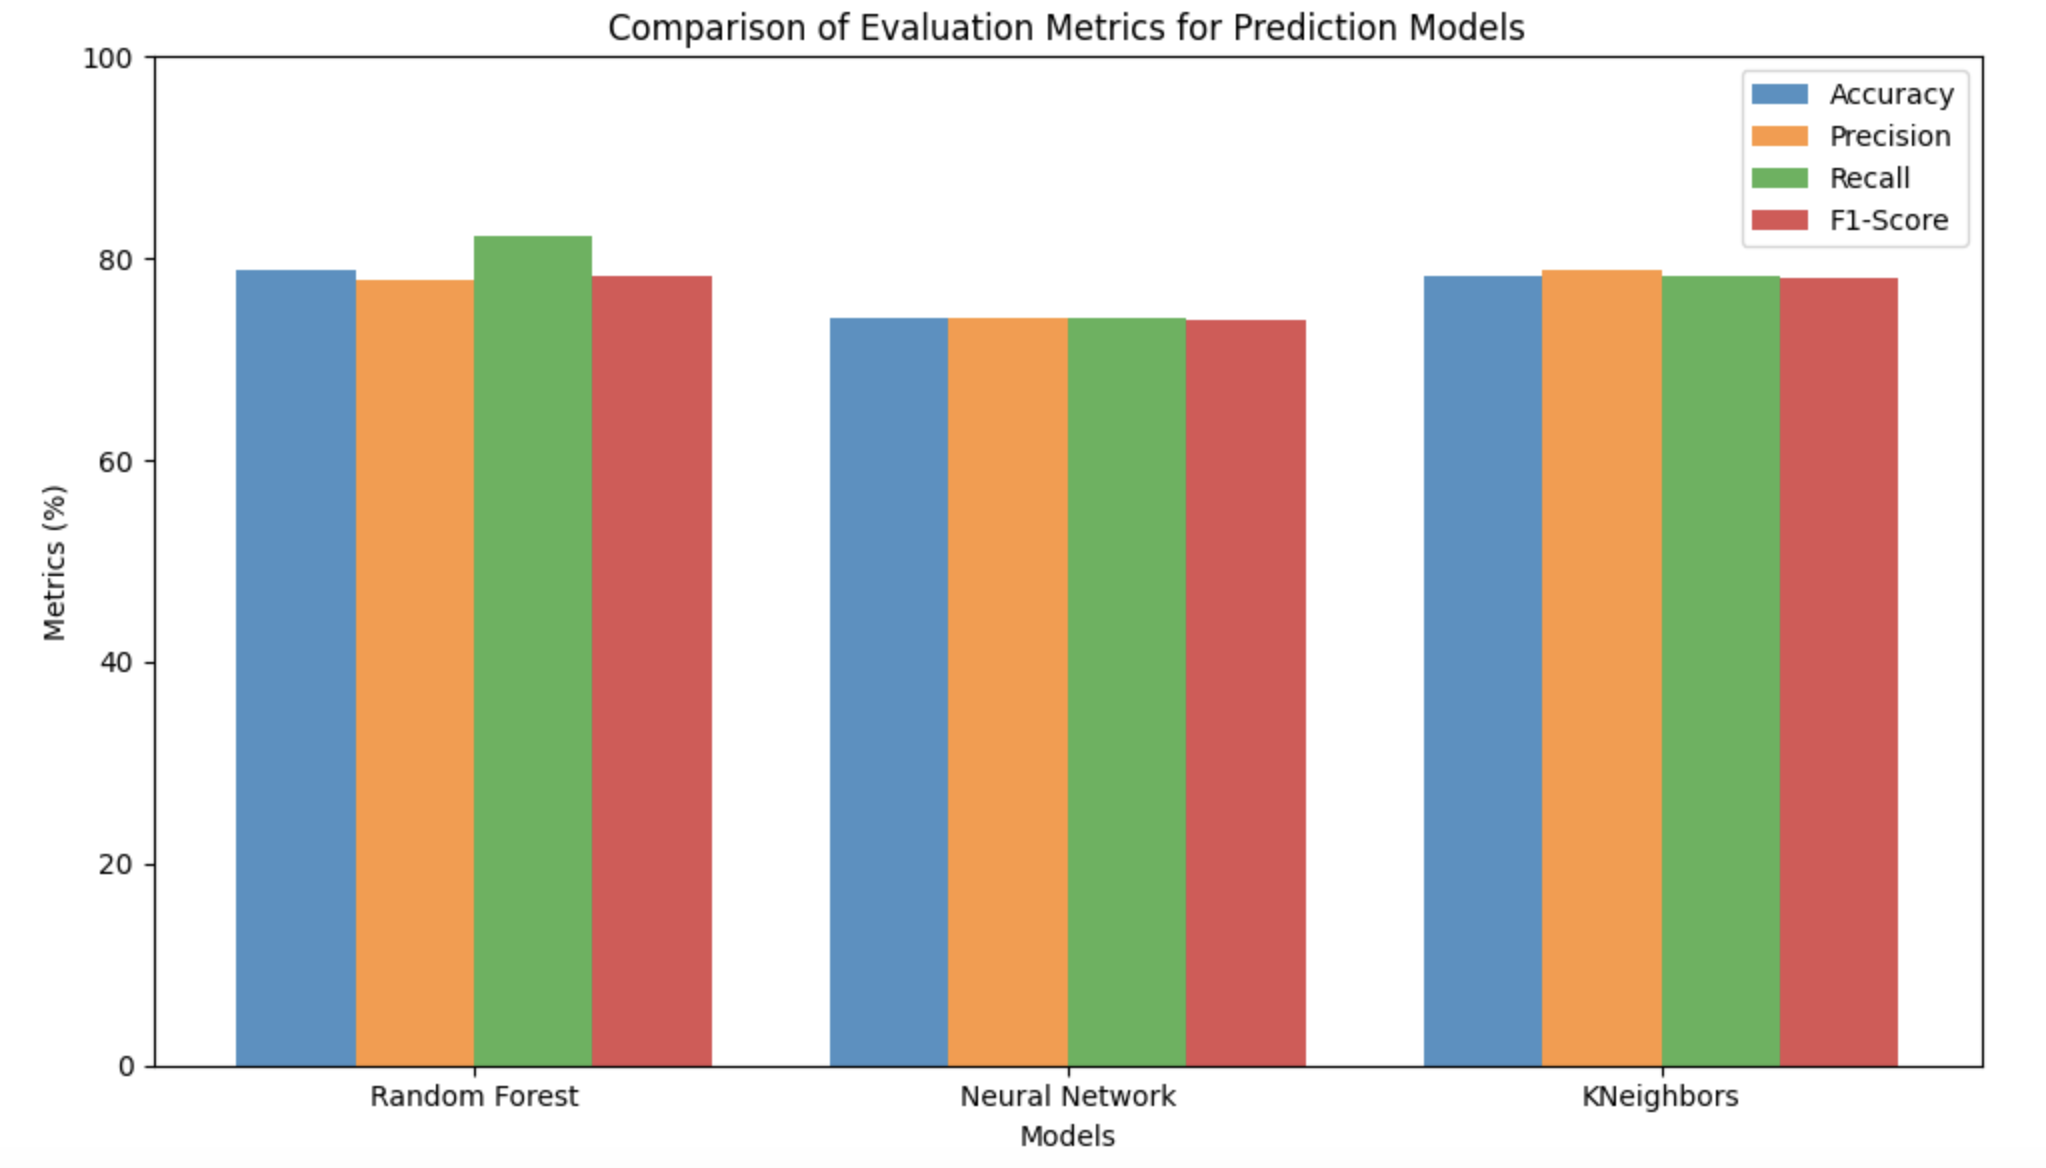
We trained and compared three models, each tuned with grid search and cross-validation, then scored on a held-out test set. The neural network was my piece; I designed and tuned it, while teammates owned the Random Forest and the K-Nearest Neighbors classifier.
| Model | Accuracy | Precision | Recall | F1 |
|---|
| Random Forest (selected) | 78.92% | 77.91% | 76.66% | 78.90% |
| K-Nearest Neighbors | 78.23% | 78.86% | 78.23% | 78.15% |
| Neural Network (Keras MLP) | 74.05% | 74.03% | 74.05% | 73.98% |
The Random Forest won. It led on accuracy and recall, resisted overfitting through bagging and random feature selection, handled the class imbalance gracefully, and, critically, exposed feature importance for interpretability. My neural network landed at 74%, a notch behind, which tracked with what the analysis suggested all along: on tabular, imbalanced financial data, tree-based models tend to beat a small MLP.
One finding is worth stating plainly: tuning lifted accuracy from around 49% to around 79%, but most of that gain came from reducing the class count and cleaning the data, not from the hyperparameters. The data and the problem framing did the heavy lifting, which is exactly what the exploratory analysis had pointed to.
And what does the chosen model look at? The Random Forest's importance scores show that cash-flow-per-share metrics dominate, with Operating Cash Flow per Share carrying the most weight. A reminder that liquidity, more than headline margins, separates the credit tiers.
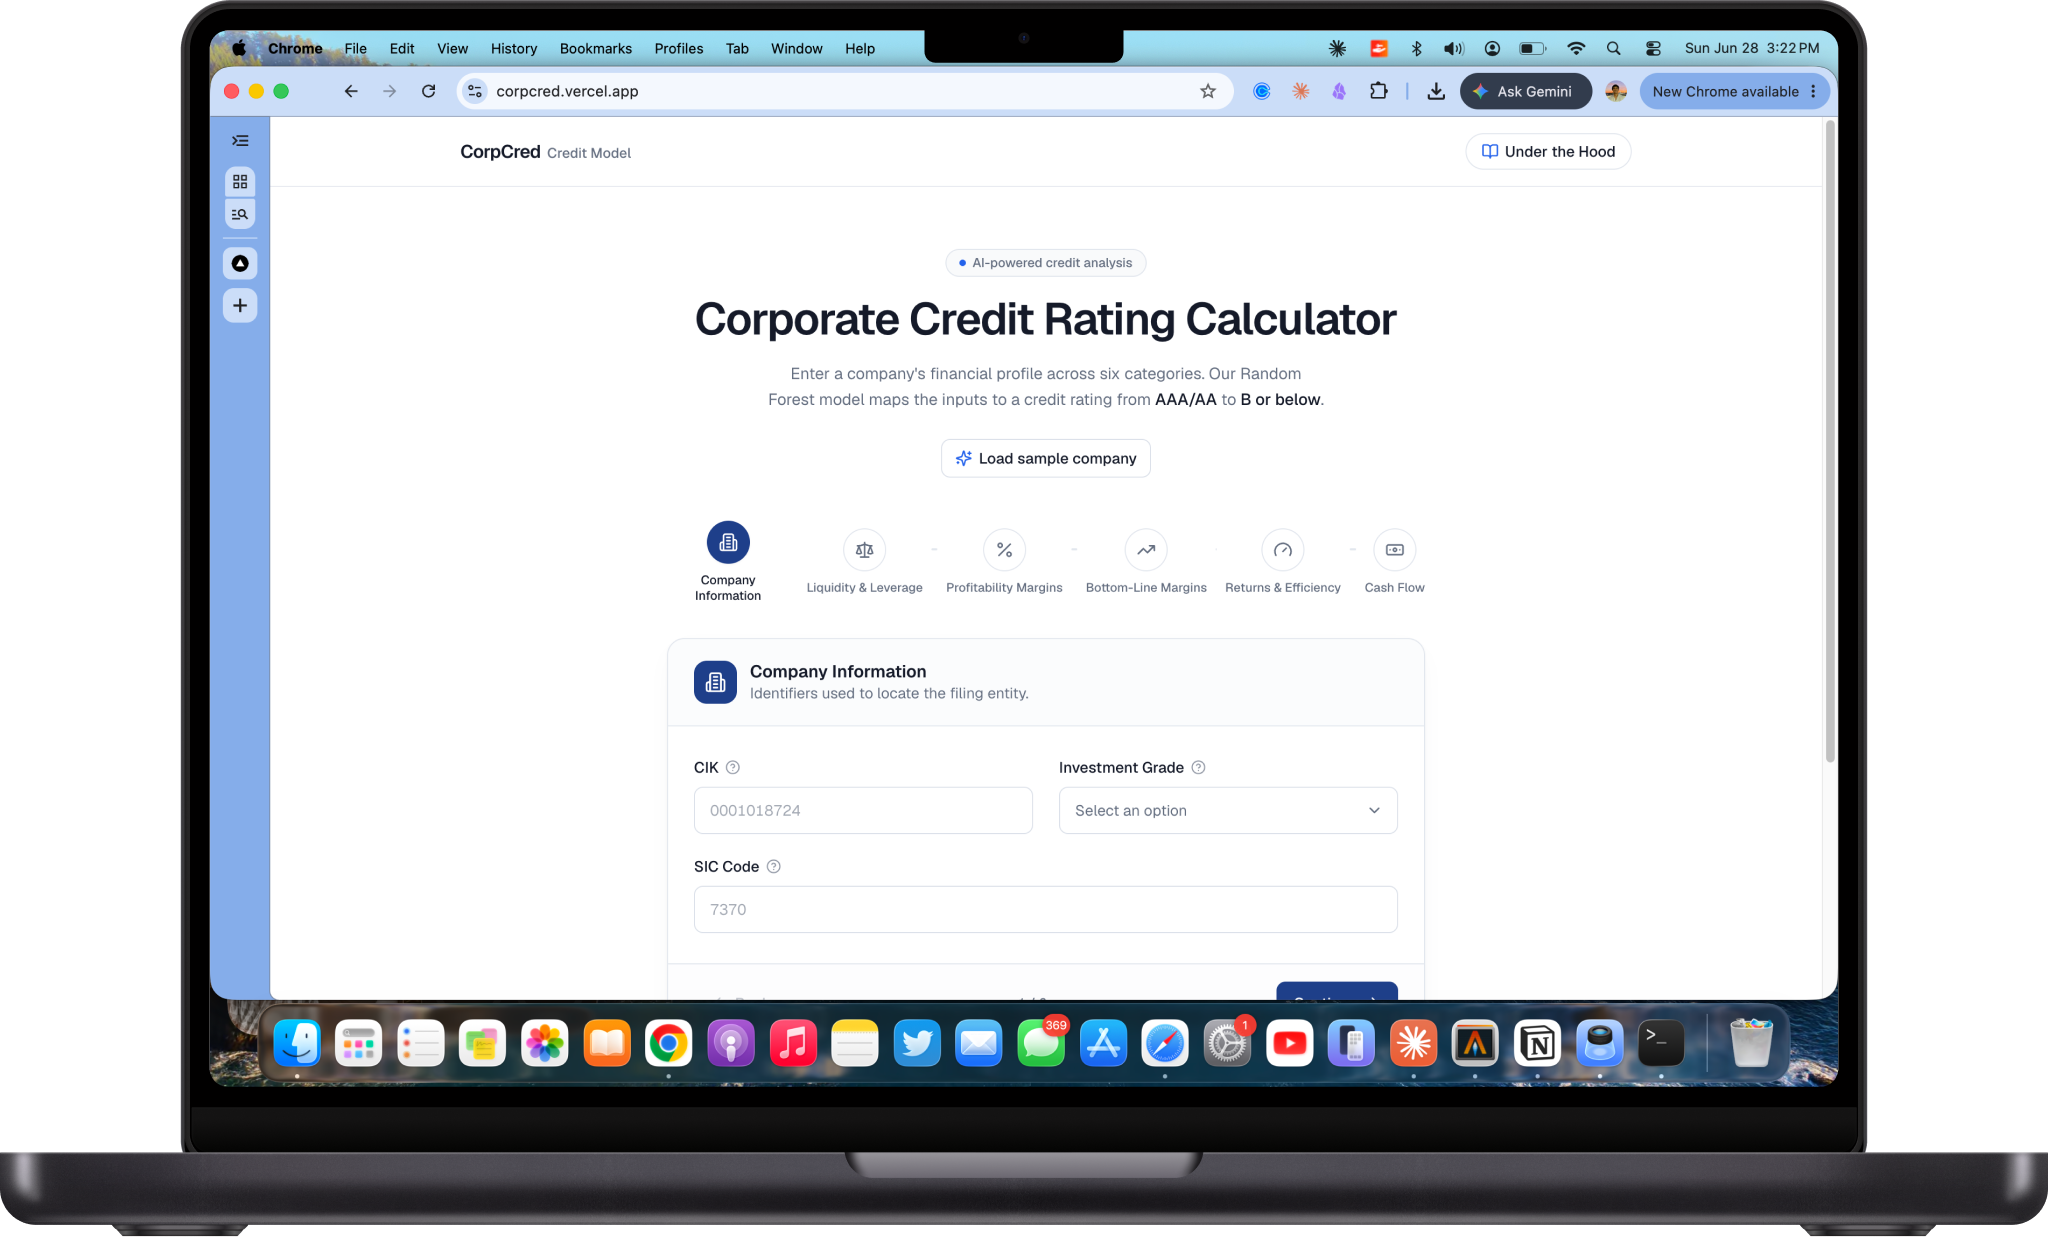
It runs in your browser
One of the nicest touches in the app the team built is that the model runs entirely in the user's browser. The trained Random Forest is exported from Python to a compact JSON file: every tree's split features, thresholds, and leaf votes, alongside the scaler's statistics. On submit, a Next.js route reproduces the exact scikit-learn pipeline in JavaScript. It standardizes the 19 inputs using the saved scaler, traverses all 50 decision trees to their leaves, and tallies every tree's vote, returning the majority class as the rating band.
No GPU, no external model host, no round-trip. The prediction completes in milliseconds, and the app is fully self-contained. The production model is a Random Forest of 50 trees, max depth 20, over 19 input features.
The team wrapped the model in a careful, guided front end: nineteen inputs grouped into six readable steps, a review screen before you run it, and a result that is a small visualization (a colored gauge and a band strip) rather than a bare label, with an "under the hood" page that explains the data and the model honestly.
What we'd explore next
- Per-prediction explainability: surface why a specific company got its rating, turning global feature importance into a per-result story.
- Confidence as a first-class signal: show how strongly the forest voted, not just the winning class.
- Richer and fresher data: more sectors, more recent filings, and ensemble or hybrid approaches to push past the roughly 79% ceiling.
What I took from it
On a five-person team, I owned the neural-network model, the exploratory data analysis, and the literature review that informed how all three models were built. The most durable lesson was not about any single model: framing the target and cleaning the data beat every hour spent on hyperparameters. And the model I built was not the one that won, which is its own useful lesson, reading the evidence and backing the better approach matters more than being right the first time.
CorpCred was a five-person research project for UC Davis ECS 171, with Abdulaziz Alhumaidy, Abdulah Haitham, Vedant Patel, Vikram Penumarti, and Elijah Alba. It produces model estimates, not official credit ratings or investment advice.
Live demo: corpcred.vercel.app · Code: github.com/Programmer7129/CorpCred · Full research paper: PDF